After purchasing each model in our line-up, we put our testers to work. Every bike is ridden 35+ miles while running through our testing gauntlet. We systematically evaluate these folding e-bikes across six separate metrics. This article explains our testing methods and what we look for in each bike we test.
Ride
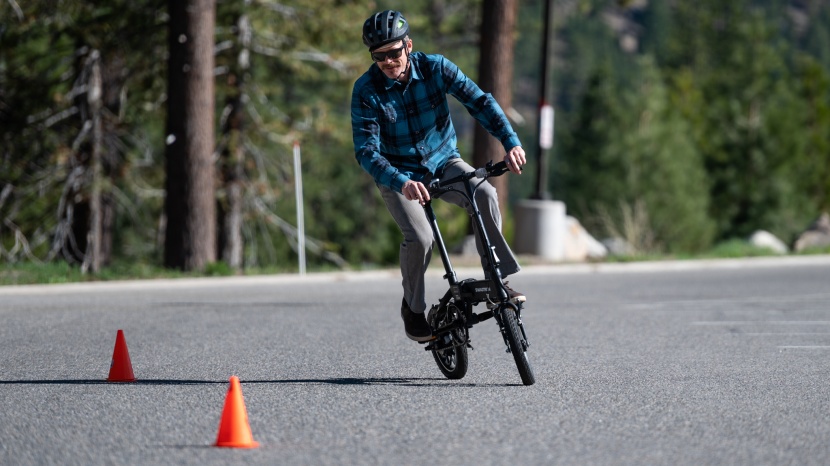
This metric measures how much fun each bike is to ride. It takes into account things like comfort, features, bike design, and the quality of the parts. We test how the bikes handle at different speeds and on different types of roads. We also check how smoothly the brakes stop, how well the drivetrain shifts, and how the wheels perform on city streets. We even set up obstacle courses to see how the bikes compare to each other. We look at how stable the bikes are when riding fast downhill and how comfortable they are when going uphill.
One of the ways we test comfort is by having riders of different sizes ride each bike and take notes on handlebar width, grip comfort, saddle shape, and body position. Our testers measure the range of adjustments possible on each model to see how adaptable they are to riders with different body types. Features also play into the user experience while in the saddle. Extra things like lights for enhanced safety and visibility, fenders to keep you dry and mud-free, and cargo racks are assessed. How all these factors come together to make the rider's experience satisfying is the culmination of this metric.
Range
To test Range, we perform a standardized range test on the same course with the same rider for all of the bikes. The same rider is used so that weight is consistent across all bikes tested. Our riders weigh in and correct for any variances in current weight with a weighted backpack. We start each test with a bike at full charge and ride until the battery is completely depleted. We record mileage using the Strava mobile app to record distance traveled, elevation gain, average speed, and elapsed time. Further, this test is performed using the throttle-only to remove the variable of rider input. This test gives us the low-end results of range performance as it does not utilize any power coming from a pedaling rider, with the aim of equalizing the playing field.
Power
We test this metric by measuring top speed, acceleration, and overall power output using the throttle and the pedal assist modes. The acceleration test involves using the throttle exclusively and timing of how long it takes to go from a complete stop to the bike's top speed (without utilizing pedal assist) on a flat, open road. We repeat this test several times for consistency and give you the average time. Our uphill power test involves riding up the same hill near the GearLab headquarters. Again, using only the throttle, we observe how well the bike handles the hill and how slow it slows down in the steepest segments. This uphill speed test also gives us a good idea of the torque/relative power of each model. We have also started to test electric bikes on a dynamometer, which gives us data on how much power and torque are at the wheel. This allows us to calculate drivetrain efficiency and validate the accuracy of manufacturers' claimed specs.
While testing pedal assistance, we note the number of settings and how well they work. We assess the difference between each mode, whether it is gradual or jumpy. We also note how much pedaling is required before the power kicks in and how long it continues after we stop pedaling. We also measured the top speed while using pedal assistance and how much effort the rider required to meet the top speed. These tests are done using a Garmin 805 and power meter pedals.
Portability
To assess portability, we weigh each bike on the same scale for consistency. We collapse each bike to its smallest folded size and measure it. We pick up each bike, load it into the backs of different vehicles, and carry it up a flight of stairs to examine the ease or difficulty of handling each one in its collapsed format. The lighter the bike and smaller the size, the more easily portable and storable it is, larger, heavier bikes tend to fair worse.
Interface
The Interface metric has a lot of variation due to each company's approach to a bike's controls, display, and battery. We measure the size of the display, note how easy the data is to read in bright and dim lighting, and investigate how customizable the displayed data is. We use the controls while riding the bike to assess their intuitiveness and ergonomics. We assess how easily the battery can be removed for charging and security purposes. We also download and use any available apps that often let you change the bike class, customize power settings, and even locate the bike.
Assembly
To measure and score the Assembly metric, we time-lapsed and recorded ourselves unboxing and setting up each bike. We take note of how well the packaging protects the bike during shipping. We take inventory of the included parts, accessories, hardware, and tools necessary for assembly, and we closely follow the included instruction manuals. We assess how well the manufacturer assembles the bike, the ease of final assembly, and the number of adjustments necessary to the bike, derailleur, brakes, wheels, handlebars, and seat before the bike is ride-ready. We also inform you whether the company provides an assembly video and whether you're better off enlisting the help of a local bicycle shop.


