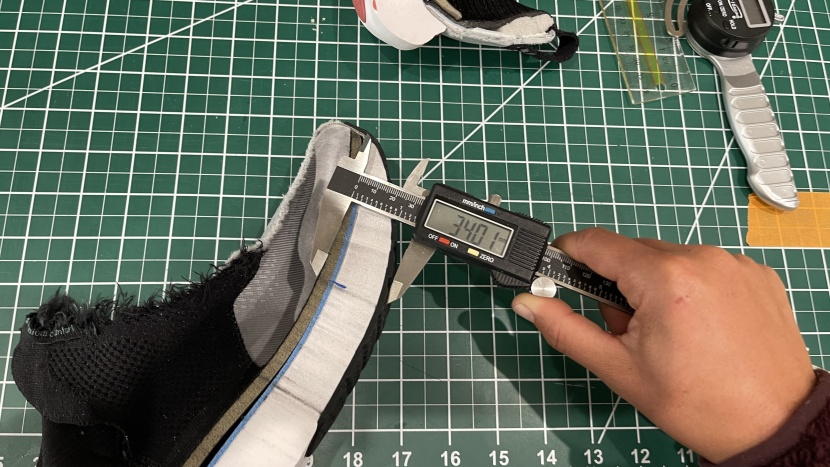
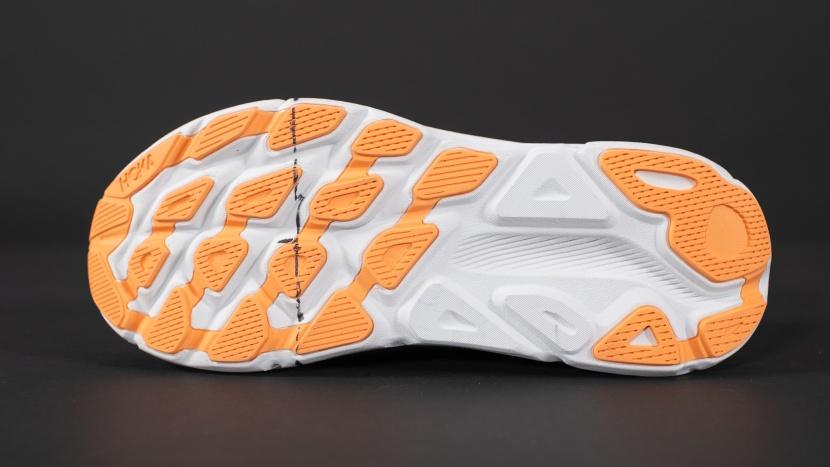
We tested the men's running shoe competitors through the streets of Helena, Montana. Each shoe was subjected to a comprehensive set of runs that began with a standardized 6-mile loop over a range of terrain, including loose gravel, hard-packed dirt, asphalt, concrete, and grass. Then, each shoe completed a barrage of other tests, including (but not limited to):
- A 6-10 mile threshold workout
- A long run lasting 90-120 minutes
- A super slow recovery run
- A treadmill run
- Alactic hill sprints
- 3k-5K paced work
- Mile paced strides, 2-3 sets
We strive to assess the shoes fairly by testing them multiple times under many conditions. Every pair was given adequate time underfoot, and most went through significantly more miles than required. We also send a second pair of each shoe to our test facility to obtain precise measurements, including heel-to-toe drop, dimensions, and toe box volume.
Comfort and Fit
Comfort was evaluated by wearing each shoe in a wide range of sessions, comparing all of the run types, and noting which upper worked best with our foot. We wore socks of different thicknesses and ran in varying weather conditions. We analyzed the roominess of the toe box and the snug fit of the heel cup, looking for hot spots or blisters. We paid attention to hotspots and, unfortunately, got a few nasty blisters along the way. And finally, we paid extra attention to which shoes we couldn't wait to take off after a run, and which ones we could wear all day long.
Cushioning
We created our standardized test loop, which features various terrains and gradients, to more accurately compare the cushioning of different products. We took each shoe on a run around the loop and noted what we liked and didn't like about the cushioning. We then took each shoe on a long run to see how well the cushioning reduced perceived fatigue. Similarly, each shoe was assessed over a far, far slower recovery run to see how the cushioning felt at slower paces. During our faster threshold and interval sessions, we noted how the cushioning felt at pace. Taking notes on fatigue, discomfort, and perceived impact helped us narrow down which cushioning we liked the best. Back in the lab, we measured the stack height in each shoe's heel and toe to report on the amount of underfoot cushioning present.
Breathability
Breathability was measured largely on a treadmill, allowing for an accurate comparison between shoes. We ran in each shoe in 70-degree temperatures with the same type of sock. We paid attention to how warm our feet felt and how sweaty they got. We also took the shoes out into the wild, testing them on hot summer days (or freezing winter runs, depending on the time of year).
Traction
We tested the traction of every pair of shoes while running across surfaces most road-based runners are likely to encounter. We ran on wet asphalt and cracked cement, around damp tracks, and along crushed gravel paths. We noted which ones require changing strides to keep from slipping, and which take away all worries and let you sail.


